
Watching an Agent Work: Observability and Evals for Lukre
How I added LLM observability and an evaluation lab to Lukre, exploring tracing, privacy, model costs and the limits of early evaluation results.
At the end of Building Lukre, I wrote that the next real step was measurement. The application side had tests. The model side had instructions and gates. And I could only hope that a change to a prompt or a model made things better.
This is the follow-up. I added observability and an evaluation lab to Lukre, the WhatsApp assistant for household finances that runs in production with real households.
I wanted answers to five questions: is it correct, how accurate is it, how long does a member wait, what does it cost, and what fails? And one rule came before all of them: production can’t get worse. No reply may ever wait for an observability vendor.
Here’s what I built, the decisions behind it, and what the numbers showed, within the limits of what they can show.
The plugin that came in the box
Hermes, the agent runtime behind Lukre, ships with a Langfuse plugin. Turning it on would have been one line of configuration.
Before putting anything on the path of a reply, though, I read its source at the exact version we pin. It had three problems:
- It blocks the reply. At the end of every turn it flushes to Langfuse synchronously. If Langfuse is slow, the agent waits, up to Hermes’ default hook timeout of 30 seconds.
- It can block tools. It registers a hook that runs before each tool call, and in Hermes that hook fails closed: if it hangs, the tool is blocked.
- It doesn’t mask anything. Its “sanitized” mode removes secrets, not personal data, and the sample rate is read once at startup.
None of that is a bug in a demo. In a WhatsApp conversation with real people, all three are. So I wrote my own collector, and the rule for it was simple: telemetry observes, it never participates.
A pipeline that stays off the reply path
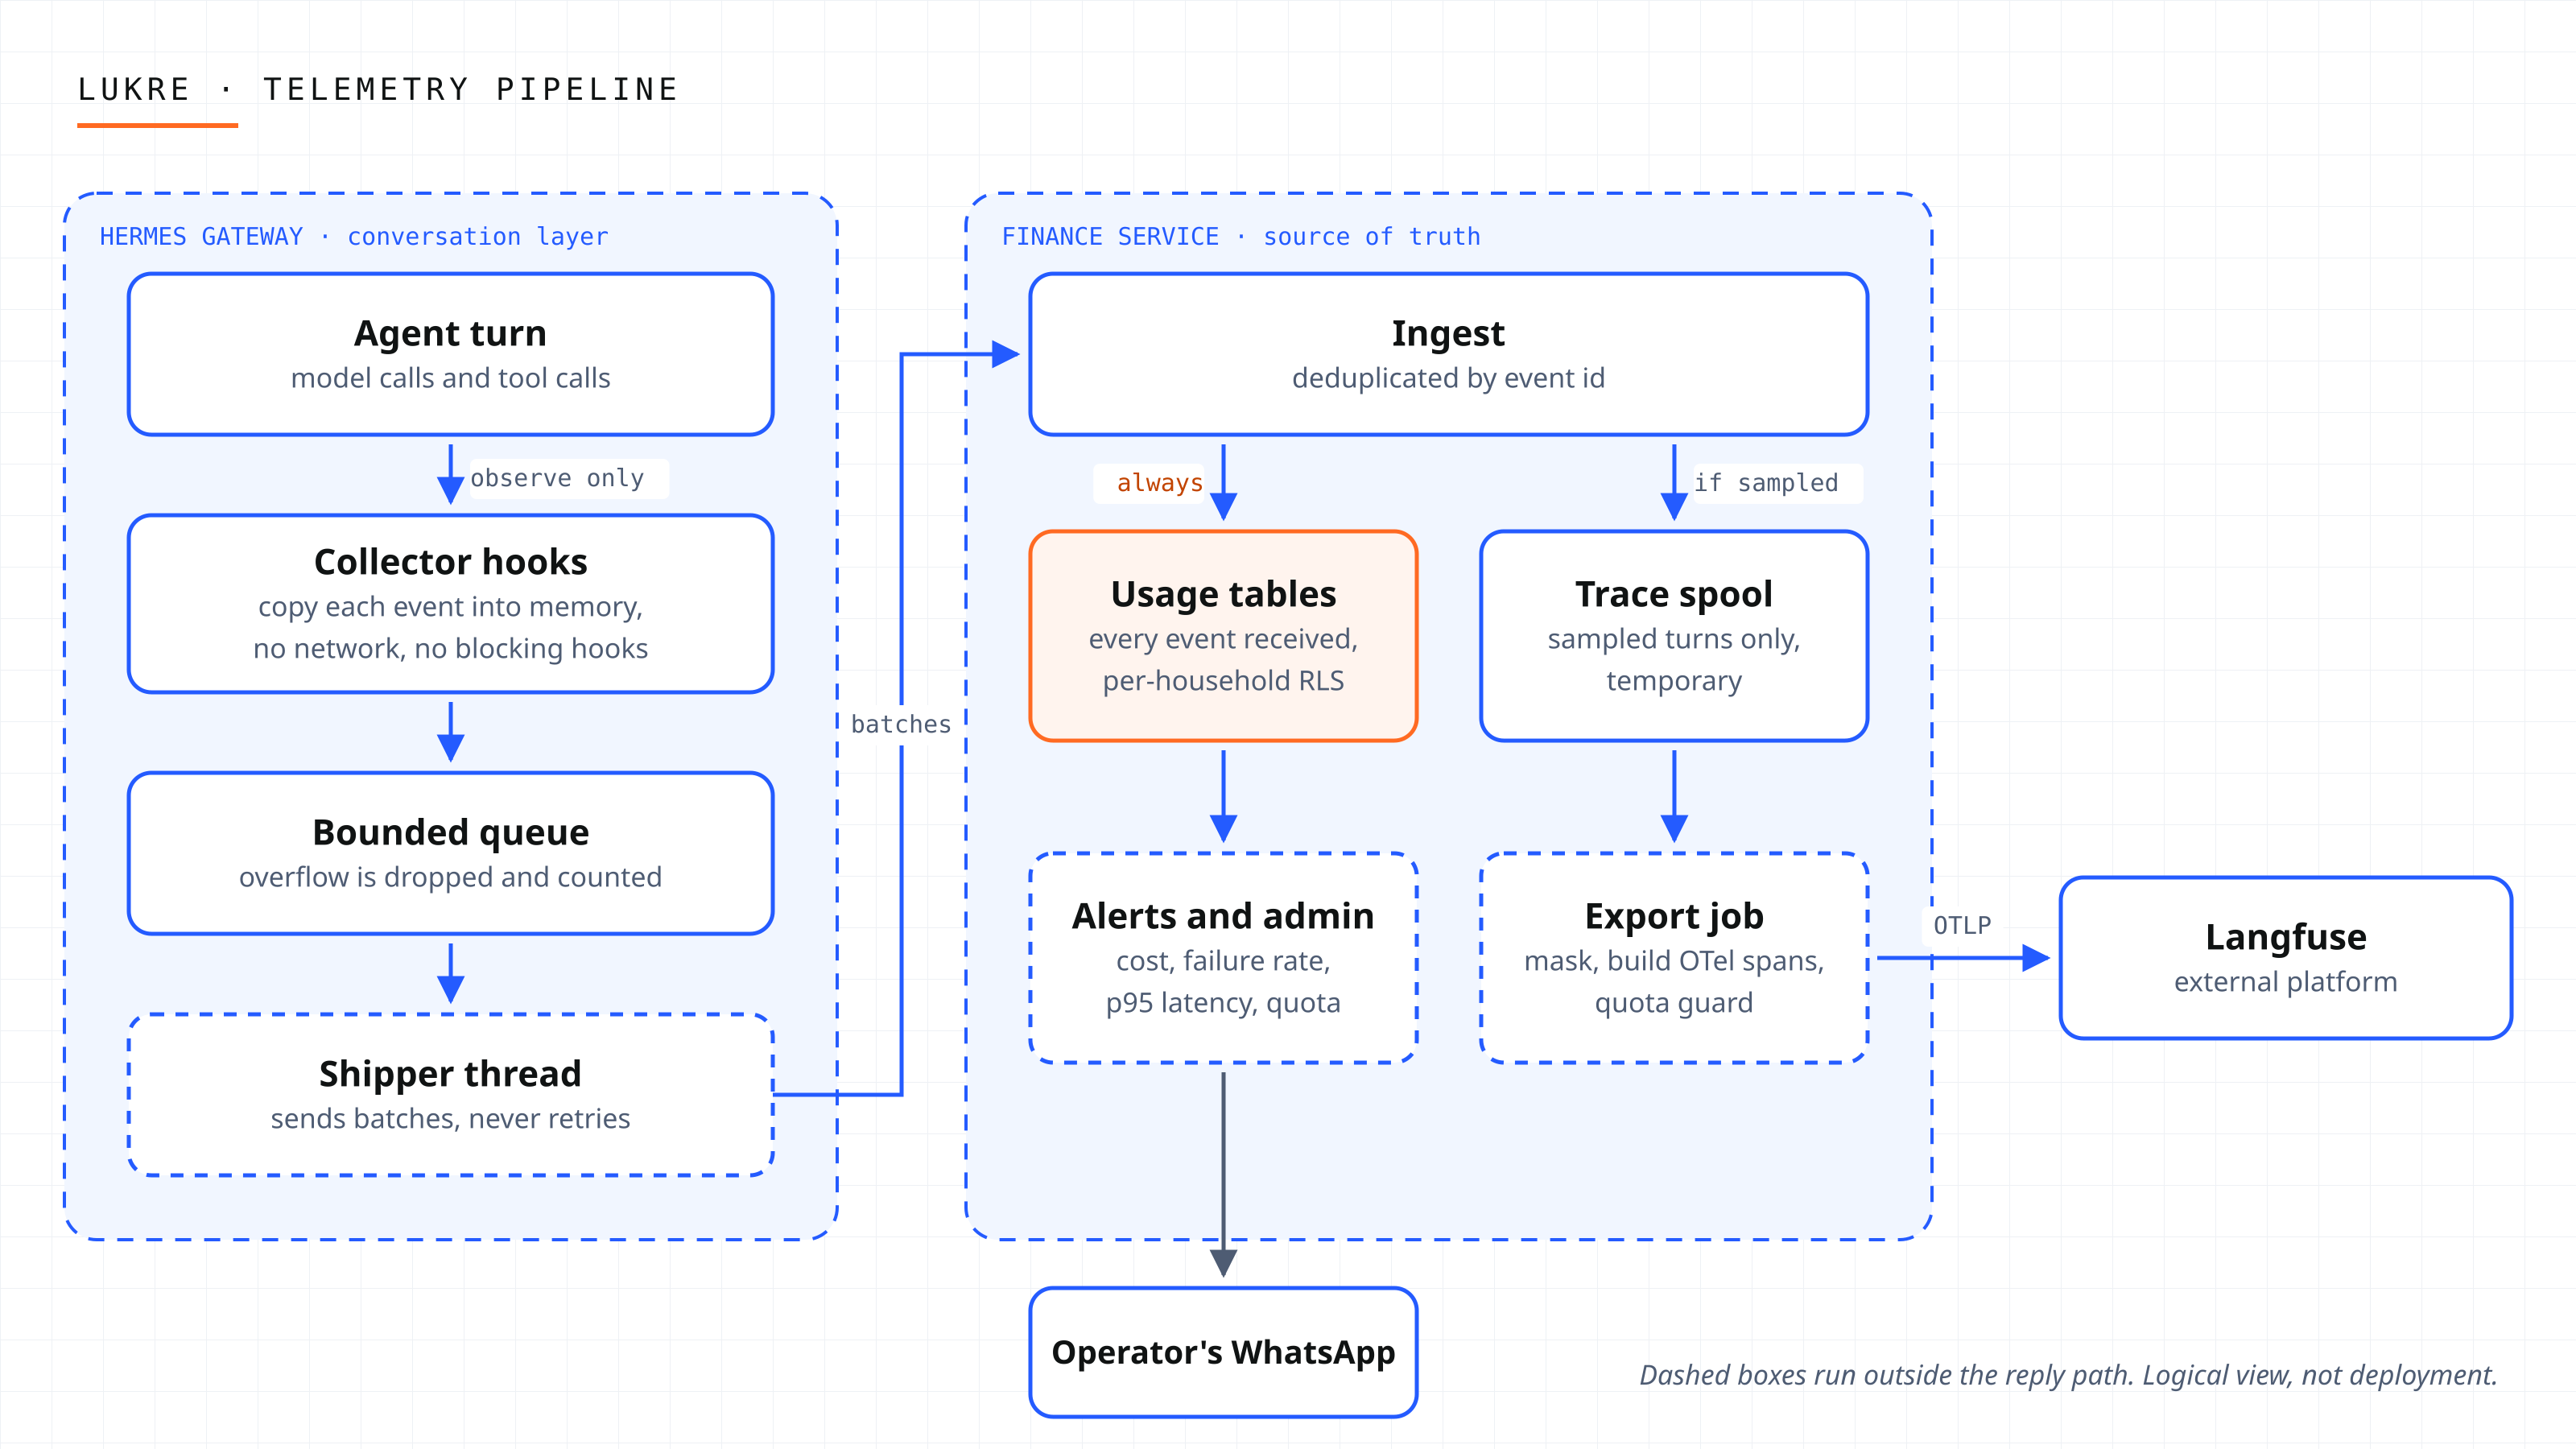
Two properties shaped the whole design.
No reply waits for an external network. The Hermes hooks only build a small dictionary and append it to a bounded in-memory queue. A separate thread ships batches to the finance service, and the export to Langfuse happens later, in a background job of that service. Even a failure in the collector is counted and swallowed:
def observe(self, hook, kw):
    try:
        fields = BUILDERS[hook](kw, self.clock())
        self.enqueue(self.event(session, turn, platform, fields))
    except Exception:
        self.callback_failed += 1


def enqueue(self, event):
    if len(self.queue) == self.queue.maxlen:
        self.dropped += 1
    self.queue.append(event)
Reduced from the collector. When the queue is full, the oldest event goes and the loss is counted. Losing a telemetry event is acceptable. Slowing down a reply isn’t. That trade-off is about observing the agent, not about money: the financial records themselves are written by the domain in their own transactions, and none of them passes through this queue.
Sampling decides what is exported, not what is counted. Traces with full content are expensive to store and to read, so only a share of turns is exported. Cost works differently. Every usage event that reaches the finance service becomes a row in the usage tables, which are per household and protected by the same PostgreSQL row-level security as the rest of the data, whether or not its turn was sampled. Sampling is decided per turn, with a hash, so every event of a turn gets the same answer even if it arrives in a different batch:
def sampled(turn_id: str, rate: Decimal) -> bool:
    """The same answer for every event of a turn: a hash of its id against the rate."""
    digest = hashlib.sha256(turn_id.encode()).digest()
    return Decimal(int.from_bytes(digest[:8], "big")) / _HASH_SPACE < rate
That makes the cost tables independent of sampling, but not a complete ledger. An event can still be lost before ingestion: when the queue overflows, when the agent process restarts with events still queued, or when a batch fails to post. The shipper never retries. If a post fails or times out, the batch is discarded and counted, and whether the service had already recorded it is unknown from the collector’s side. Rows are inserted with their event id and duplicates are ignored, so anything that does arrive twice is counted once. In practice, the cost tables are a lower bound: complete when nothing was dropped, and the drop counters say when something was.
Choosing the tools
Two choices shaped everything else: the platform that stores and shows the traces, and the format that carries them there.
Langfuse as the platform. I started from requirements, not from a vendor list. I needed traces shaped like an agent turn: nested model calls and tool calls, with tokens and cost on each one, grouped by session and user. I needed datasets, experiment runs and scores in the same place, so production traces and the eval lab could live side by side and a bad trace could become a test case. I needed OpenTelemetry ingestion, so the instrumentation wouldn’t be written against one vendor’s SDK. And I needed a way to keep personal data out, which in practice meant masking on our side before anything left.
Langfuse covered all of those. Hermes already had an integration for it, even if I didn’t use that integration in production, and its data can stay in an EU region. Phoenix was the main alternative I tried. It’s built for LLM tracing and evals too and also speaks OpenTelemetry, but it had no integration in Hermes, and running either tool ourselves would have meant operating an analytics stack next to the product. I chose not to.
The trade-off is that trace data leaves Lukre’s own systems. That’s why masking became the most important part of the design, and why the privacy policy was updated to disclose Langfuse before anything was sent.
OpenTelemetry as the format. In production, the export uses plain OpenTelemetry over OTLP, with attributes from the GenAI semantic conventions. Those conventions are still marked as in development, so I pinned them to version 1.37 in code and expect renames. The Langfuse SDK only appears in the eval lab, where datasets and scores are its strength.
attributes.update({
    "gen_ai.operation.name": "chat",
    "gen_ai.request.model": model,
    "gen_ai.usage.input_tokens": tokens["input"],
    "langfuse.observation.type": "generation",
    "langfuse.observation.usage_details": json.dumps(usage),
})
The gen_ai.* keys are OpenTelemetry’s. The langfuse.* keys are Langfuse’s own fields, and they’re what makes a span show up as a generation with token usage in its interface. Each turn becomes one root span with one child per model call and per tool call, timed with the event’s own timestamps rather than the moment of export. Moving to another backend wouldn’t be free: the langfuse.* layer would have to be rewritten. But the spans, their structure and the gen_ai.* attributes would carry over.
Masking before anything is exported
Debugging an agent means seeing what each model call and each tool call received and returned. Metadata alone can’t explain a wrong tool choice. So spans carry that content, with identifiers masked, and never attachments.
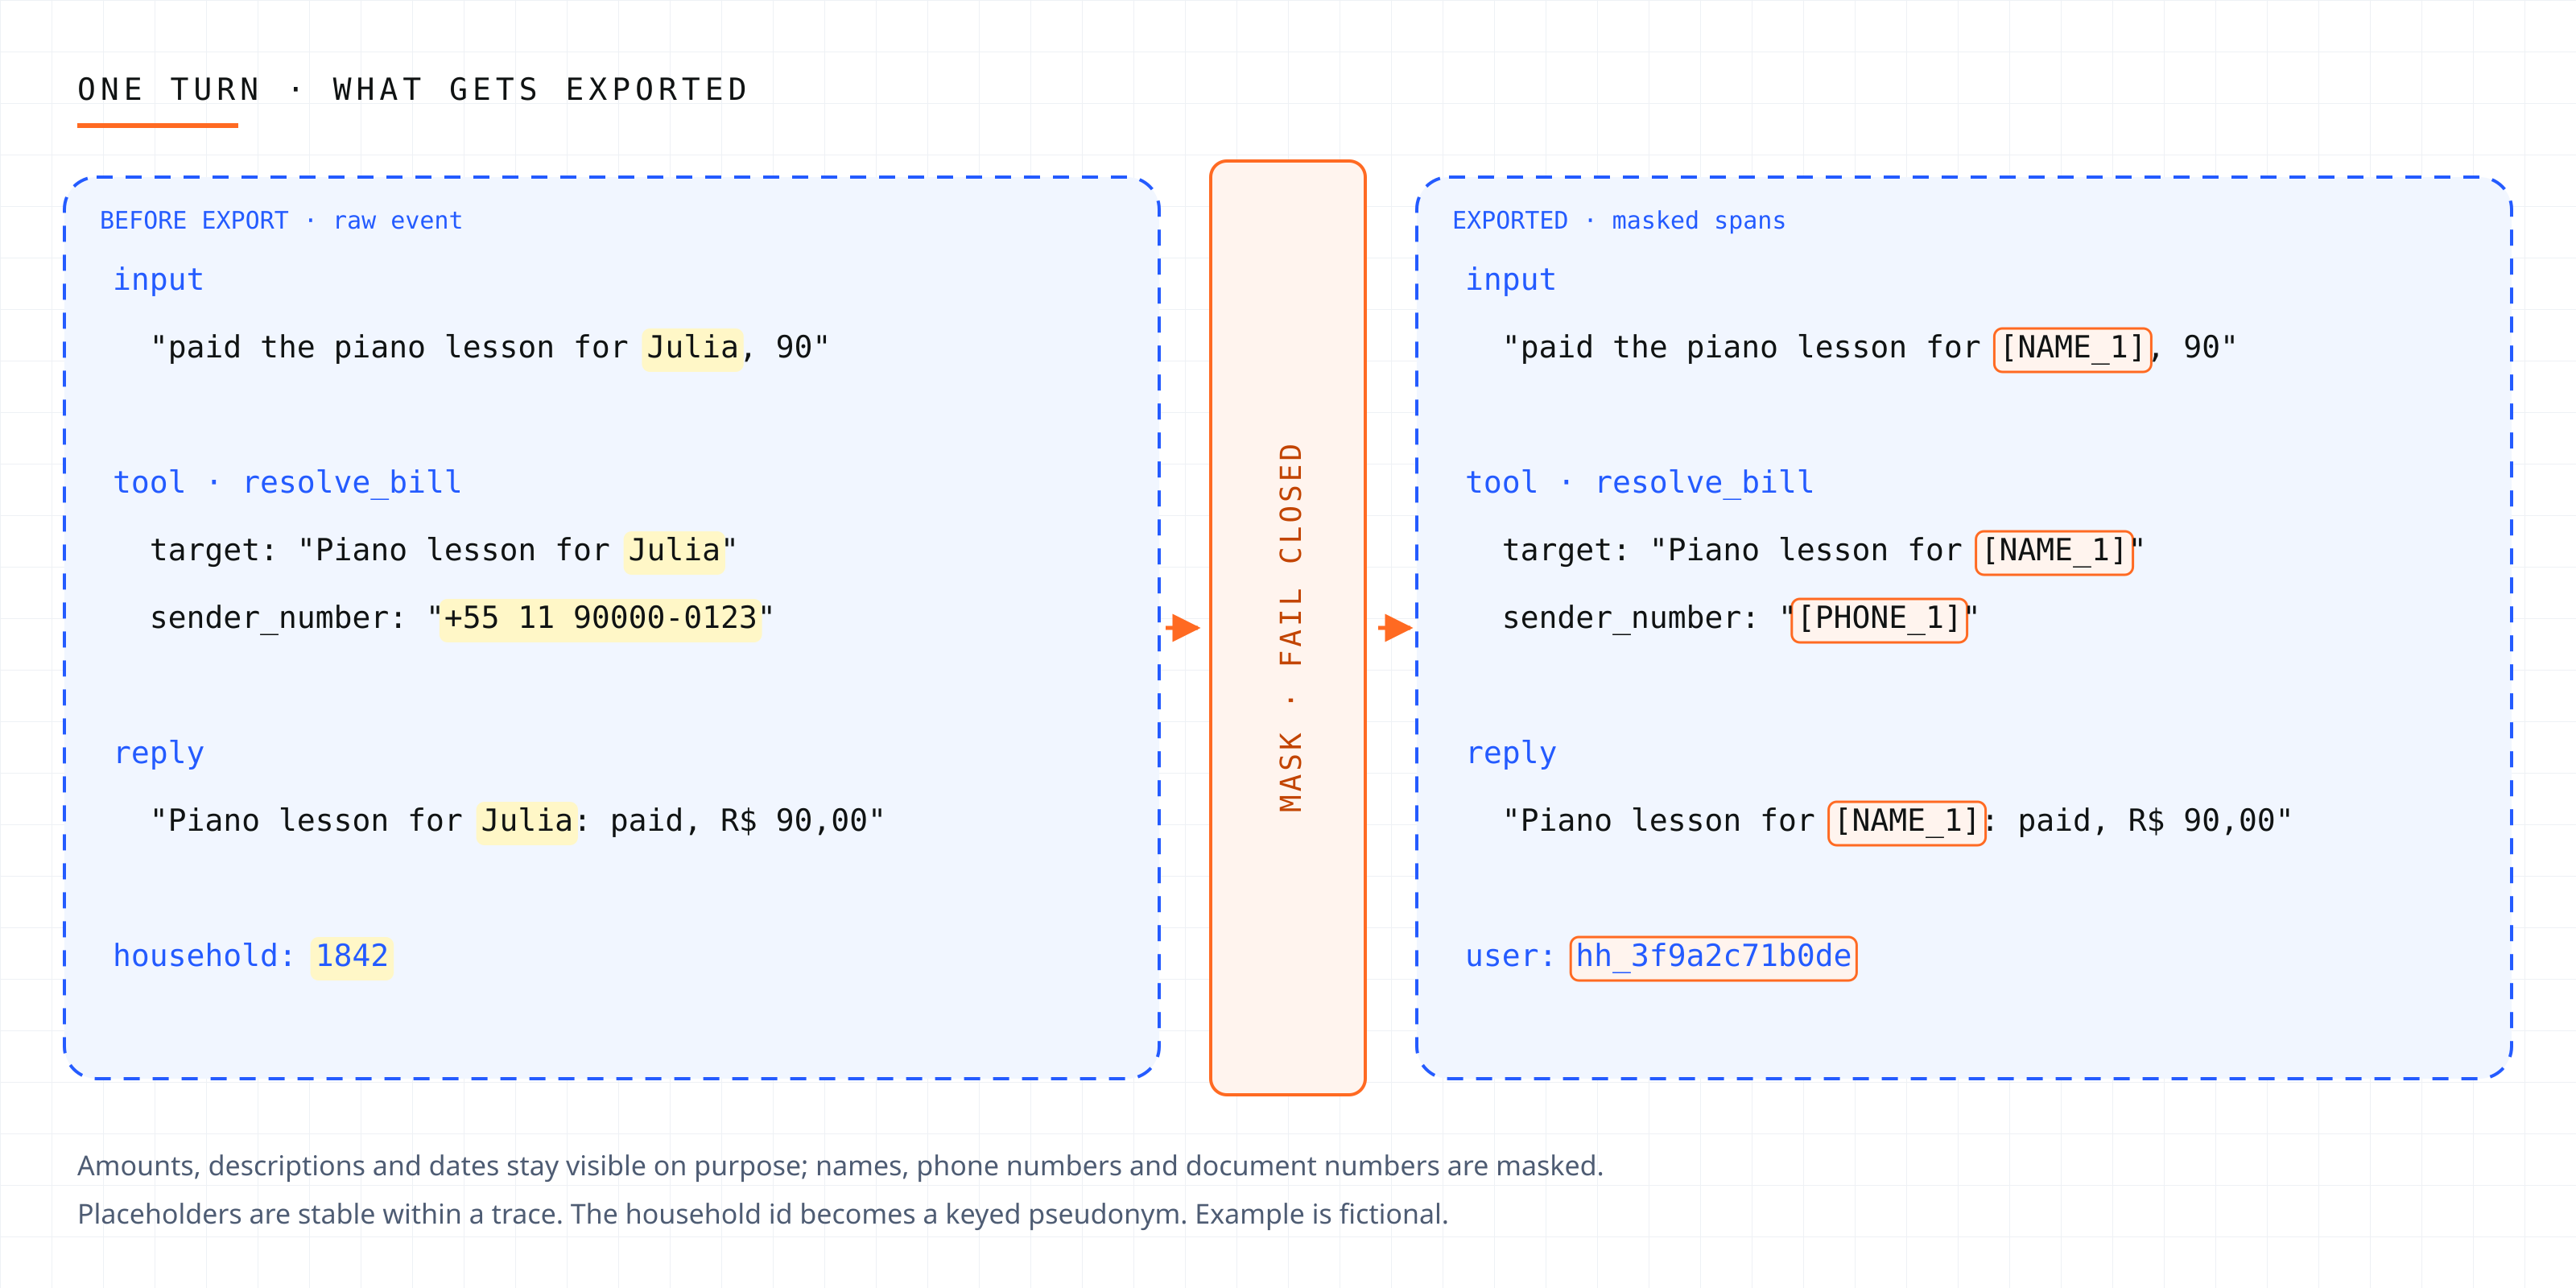
There’s no machine-learning model behind the mask. A named-entity model would add a heavy dependency, and its misses are hard to reproduce in a test. The mask is deterministic and applies three layers in order:
- the names and phone numbers of the household’s own members, read from the database;
- validated patterns: Brazilian tax ids with their check digits, card numbers with the Luhn check, emails, postal codes, addresses and phone numbers;
- a list of about 3,000 common first names and 1,000 surnames.
Placeholders are stable within a trace, so the same person is always [NAME_1]. The household id becomes an HMAC pseudonym, keyed with a secret that never leaves the service. And the mask fails closed: any value it can’t handle, or any exception while masking, becomes [REDACTED].
Patterns are where the bugs hide. One phone format I missed, with a space after the leading mobile digit, was caught in code review and is now a test case. And a price like “R$ 11999,90” must never look like a phone number, which is its own test.
It’s important to be clear about what this is and isn’t. Masking removes direct identifiers. It isn’t anonymization. Amounts, descriptions and dates stay visible on purpose, because they’re what it takes to debug a financial agent, and in the wrong combination they can still say something about a household. A name that isn’t in the members’ data or the name list can get through. The pseudonym protects the household id from anyone without the key, and nothing more.
After the deploy, I checked what had actually reached Langfuse. In the 18 exported observations I inspected, a scan for phone numbers, first names and surnames found none of them, and found 20 placeholders where they had been. That’s evidence that the mask worked on those turns, not proof that it never misses.
Sampling within a budget
Langfuse meters usage in units, and each turn uses a handful of them, depending on how many calls it makes. Production has a monthly budget, and usage is counted on our side, because asking Langfuse for it is rate-limited.
Below a guard fraction of the budget, the configured sample rate applies. Above it, the rate scales down so that the projection for the rest of the month ends inside the budget:
def effective_rate(configured, units_month, share, day, days_in_month):
    """Configured below the guard; above it, scale so the month ends within the share."""
    if units_month >= share:
        return Decimal(0)
    if units_month < GUARD_FRACTION * share:
        return configured
    daily = Decimal(units_month) / Decimal(max(day, 1))
    projected = daily * Decimal(max(days_in_month - day + 1, 1))
    guarded = (Decimal(share - units_month) / projected).quantize(_RATE_STEP, ROUND_DOWN)
    return min(configured, guarded)
A lower rate only means fewer detailed traces. The usage tables don’t depend on it.
The export is where delivery semantics matter, because a timeout doesn’t mean what it seems to. When the job gives up waiting, the request may never have left, may have reached Langfuse and been processed, or may have been processed with the response lost on the way back. From the job’s side, the outcome is unknown. So the export never assumes it failed cleanly. Spool rows are deleted only after Langfuse confirms a batch; anything unconfirmed stays and is sent again on a later run. To make that resend safe, trace and span ids are derived deterministically from the household and the turn, so a turn exported twice carries the same ids both times and lands on the same observations instead of creating a second trace. The HTTP client is also budgeted to finish within the job’s wait, which makes a late arrival after the job has moved on unlikely, though the design doesn’t depend on it. That’s at-least-once delivery with idempotent ids, not exactly-once.
Some failures aren’t worth retrying. If Langfuse rejects a batch as malformed or too large, sending the same bytes again won’t help, so the batch is split in half and resent until the turn it doesn’t accept is alone. That turn is dropped and logged, and the rest of the spool keeps moving.
Alerts
Langfuse is where traces are explored one by one. But questions like “how much does each household cost this month?” need a history that stays with Lukre, so the admin dashboard got an observability page of its own. It reads the usage tables and shows cost per household, response time, failures and quota.
I don’t want to stare at that page, though. A background job checks the numbers on a schedule and sends me a WhatsApp message when one of them crosses a line:
- the monthly trace budget nears its limit;
- the share of failed turns goes above a threshold, once there are enough turns for one failure not to count as a trend;
- the slowest replies take longer than they should;
- the day’s cost goes above a set limit, or one household costs several times more than the typical one.
The messages go out through the same queue that already delivers reminders, at most one per kind of alert per day, so a bad afternoon doesn’t become fifty notifications. The thresholds can be changed in the admin.
What the traces said about cost
This part confirmed what I expected, with numbers.

One warm-cache production call, itemized. Costs are estimated from token counts and the model’s per-token prices.
Every round trip to the model sends the whole context again: instructions, persona, tool definitions and the session history. In the call I itemized, that was 168,464 input tokens, and 167,936 of them came from the provider’s prompt cache. Only 528 were new. In an agent with tools, that’s where the cost was always going to be. The good news is that the cache was already doing its job: cached tokens are billed at a tenth of the normal input price, which kept the whole call at about $0.0045 even with 93% of it going to context.
That 93% describes one call, not the system. The other warm calls I looked at carried between about 167,000 and 183,000 tokens of context, and the ones in the same turn cost within a few tenths of a cent of it, which suggests the same shape. But I only broke down this one. The contrast with a cold cache is clearer: the first call after restarting Hermes, before the provider had anything cached, cost $0.042, almost ten times as much. That’s a single observation, but it matches how the pricing works.

One production turn. Each tool result means one more round trip with the whole context.
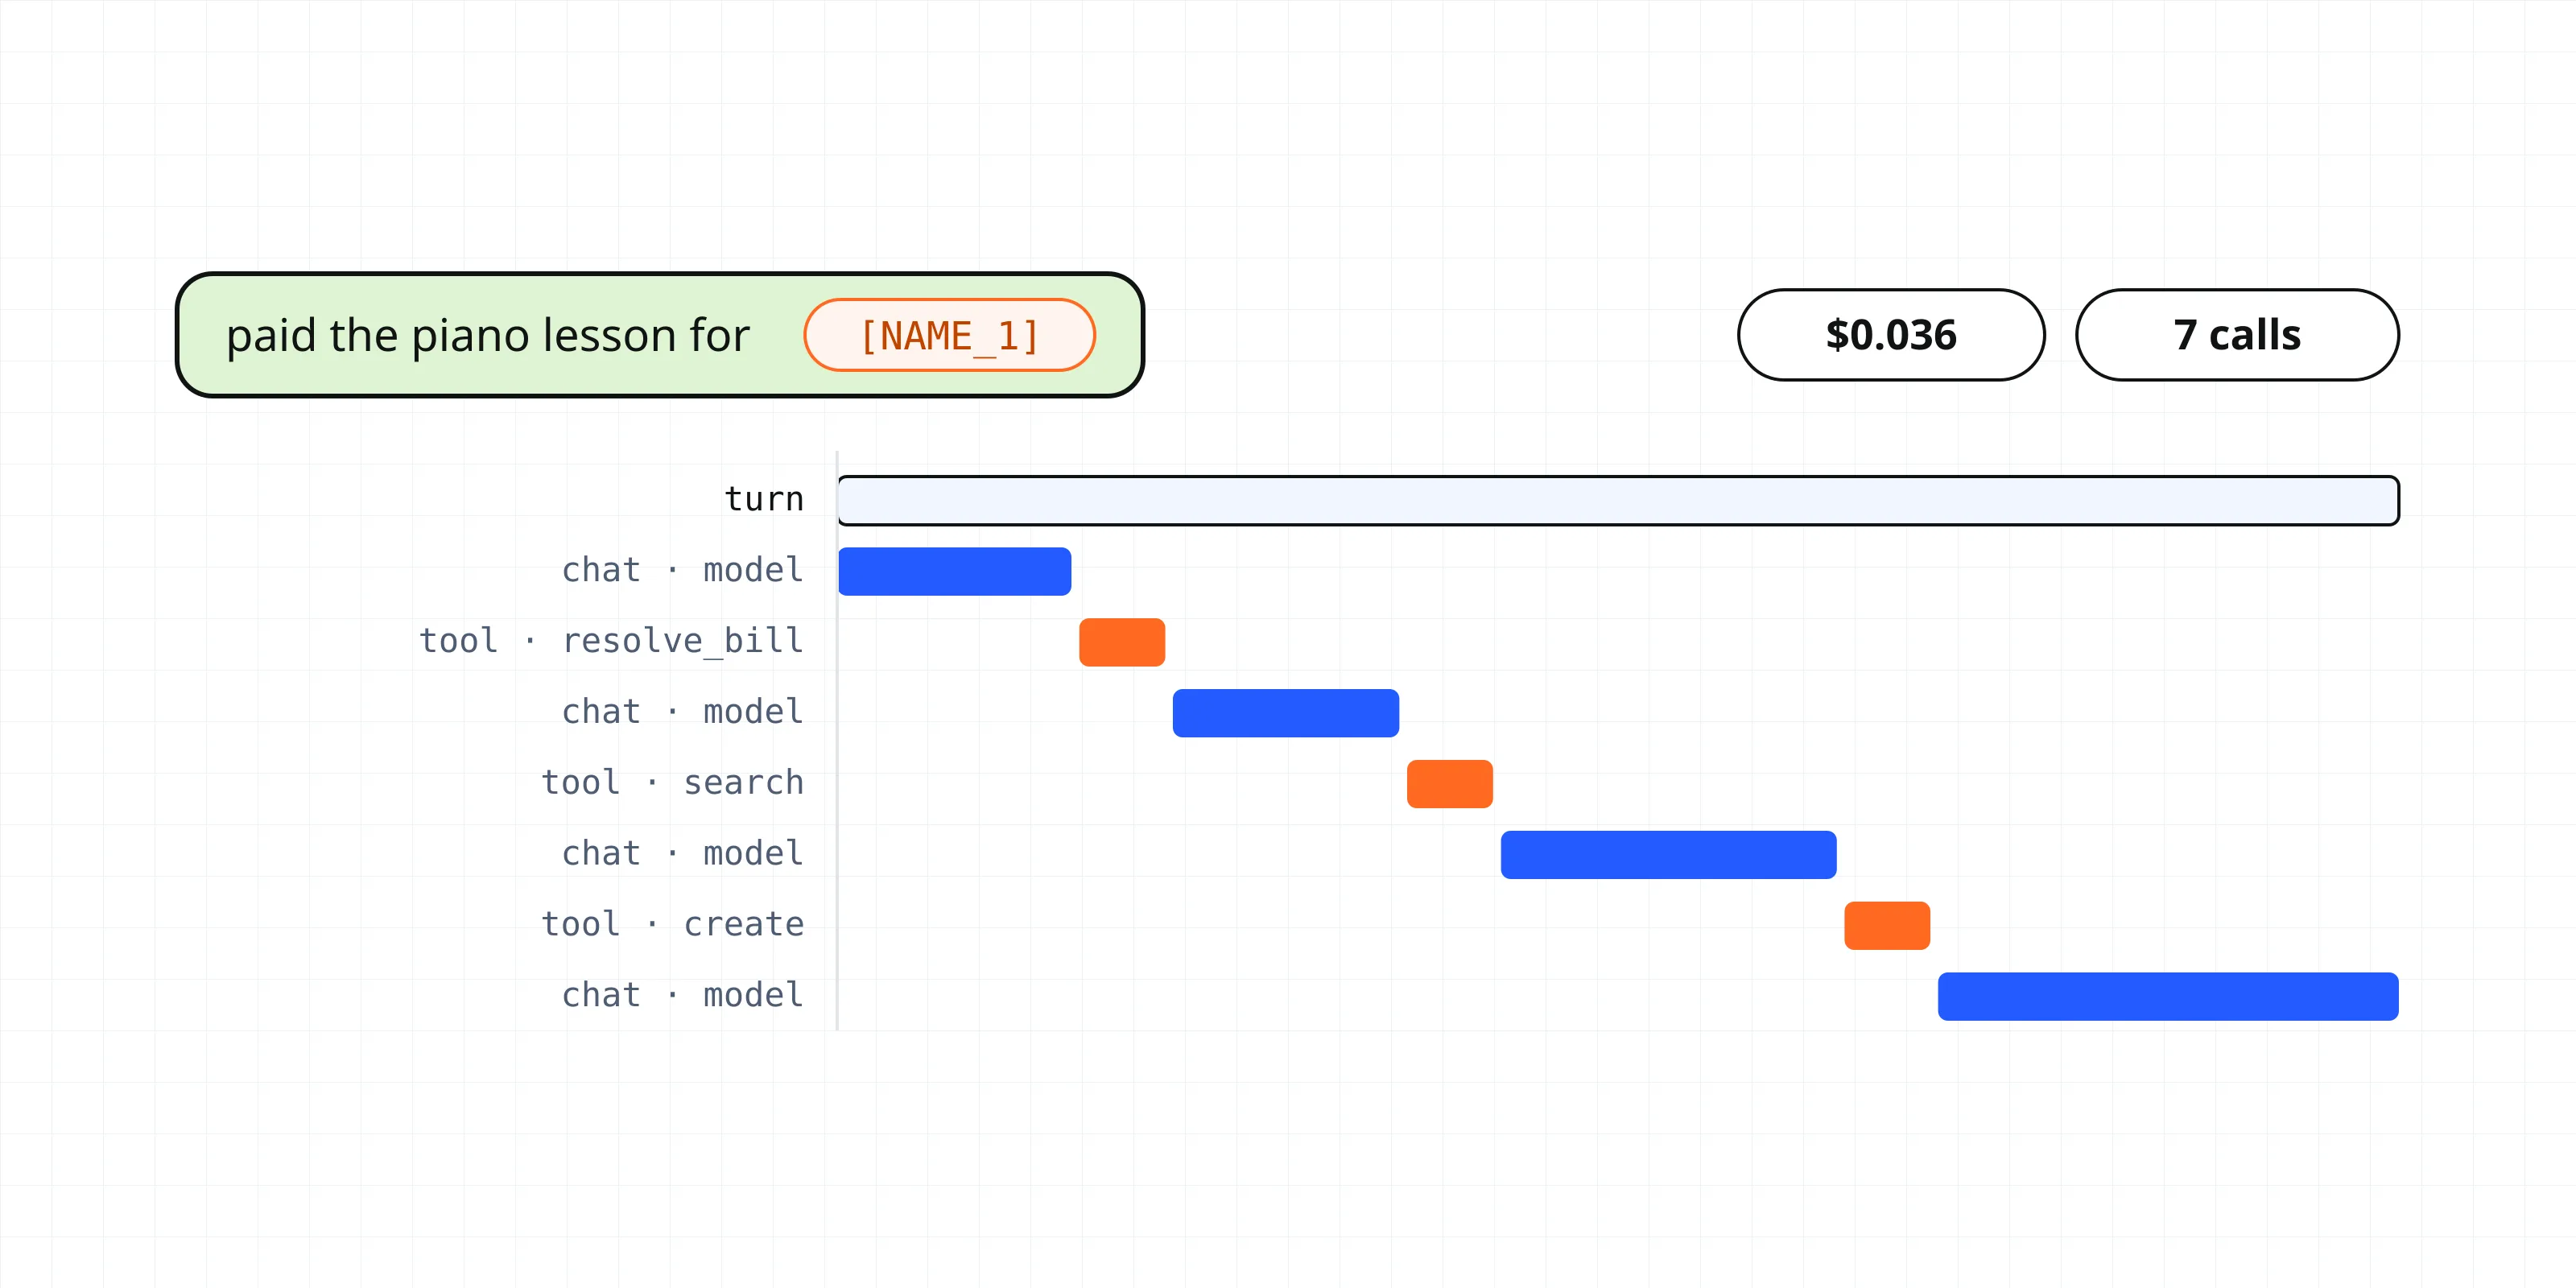
One busy turn used six tools and seven model calls, for $0.036. The cost of a turn follows the number of round trips, not the length of the message. The call after list_recurring received about 11,000 new tokens of tool output and cost 60% more than its neighbors.
So the savings, when they come, will be in context engineering, not in shorter prompts to the user: a smaller fixed context, fewer round trips per message, and tools that return leaner results. None of that is done yet. Now, at least, I can measure it when it is.
The eval lab
The second half of the work was a lab to answer the question from the last article: does a change make the agent better or worse?
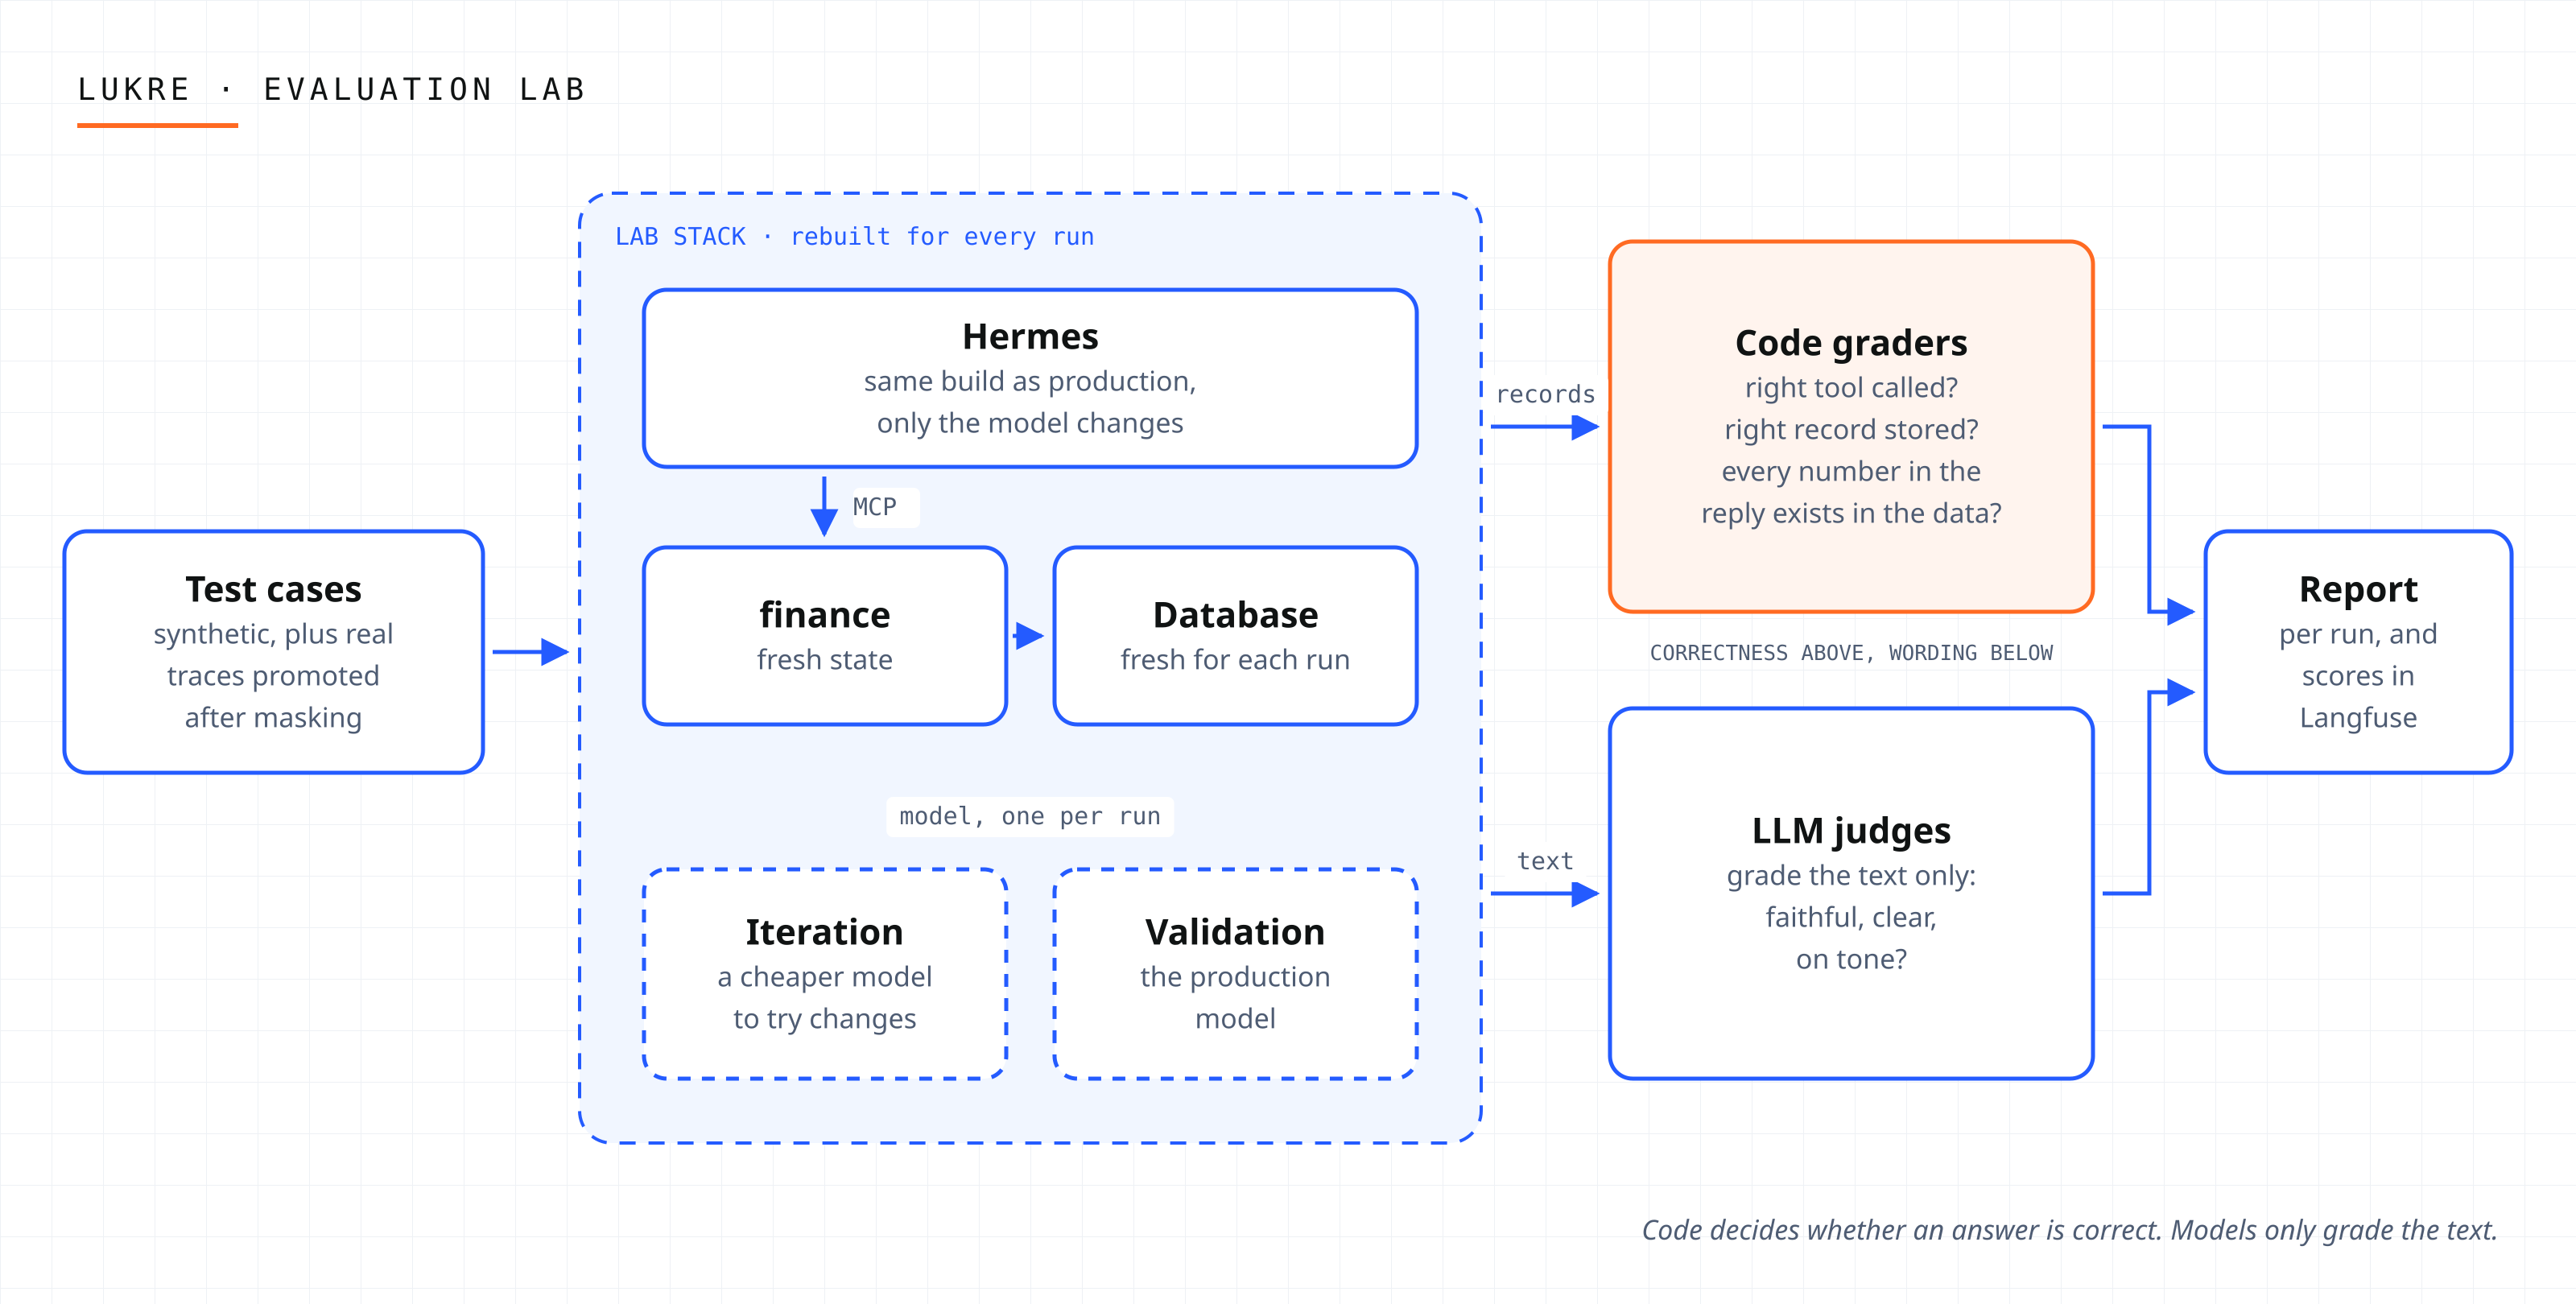
Two decisions define it:
- Same agent as production. The lab runs the production build of Hermes with the production profile template, against a fresh database for every run. Only the model changes. A lab that runs a different agent measures a different agent.
- Code decides, models give opinions. Whether the right tool was called, whether the stored record has the right amount, type and category, and whether every number in the reply exists in the data are all checked by code, reading the database after the turn. LLM judges only grade the text: faithful, clear, on tone.
Real conversations can also become cases. One command turns a production trace, already masked, into a test case, which stays out of the runs until someone writes down the expected result.
The first validation run used five synthetic capture cases and the production model. All five entries were recorded correctly, and the run cost $0.024. Five synthetic cases are a smoke test, not an accuracy figure: they show that the lab, the graders and the reports work end to end for the cases exercised. They don’t yet say how good the agent is across what real households send. That needs more cases and more journeys.
How the work was done
The process deserves a few lines, because it’s part of how I work now.
Everything started with a feasibility spike: reading the Hermes hooks, testing the built-in plugin, and trying Phoenix. Then a product requirements document with user stories, a technical specification, and 14 architecture decision records, each with context, alternatives and consequences. The specification included a contract of the tests to be written before any code existed.
The implementation was split into eight tasks with a dependency graph and executed by coding agents in parallel, in three waves. A code review then raised 20 findings, one critical, five high, ten medium and four low, and all of them were fixed. Several of the details in this article, from the phone pattern to the split of rejected batches, came from that review. The unit and plugin suites now hold more than 2,900 tests.
The numbers, with their limits
The cost figures come from a few production turns on the day of the deploy, and the costs are estimates from token counts and per-token prices. Response times in production were between 6.2 and 6.5 seconds per turn in that same small sample. The lab figures come from five synthetic cases, reviewed by an AI model rather than by me. They show the instruments work. They’re not a benchmark, and I’d rather say that here than have a reader find out.
What’s next
One change is on my list. Today, the hand-off from the agent to the finance service is an in-memory queue drained by a thread. It never slows a reply, but events still waiting in that queue when the agent process restarts are lost, and so is a batch whose post fails. Both are counted, not recovered. A message broker between the two would make that hand-off durable and let more than one consumer read the same events. It would also be one more service to run and watch, so it has to earn its place. That’s the next decision, and like the others, it gets its own ADR.
Following the money
Lukre exists to answer one question for a household: where did the money go? The groceries, the electricity bill, the delivery app nobody admits to using.
Observability turned that same question on Lukre itself, and the answer looked a lot like a household statement: one line much bigger than all the others. For a household, it’s often the delivery app. For Lukre, in the call I itemized, it was 167,936 tokens of cached context, sent again on every round trip and taking 93% of the bill.
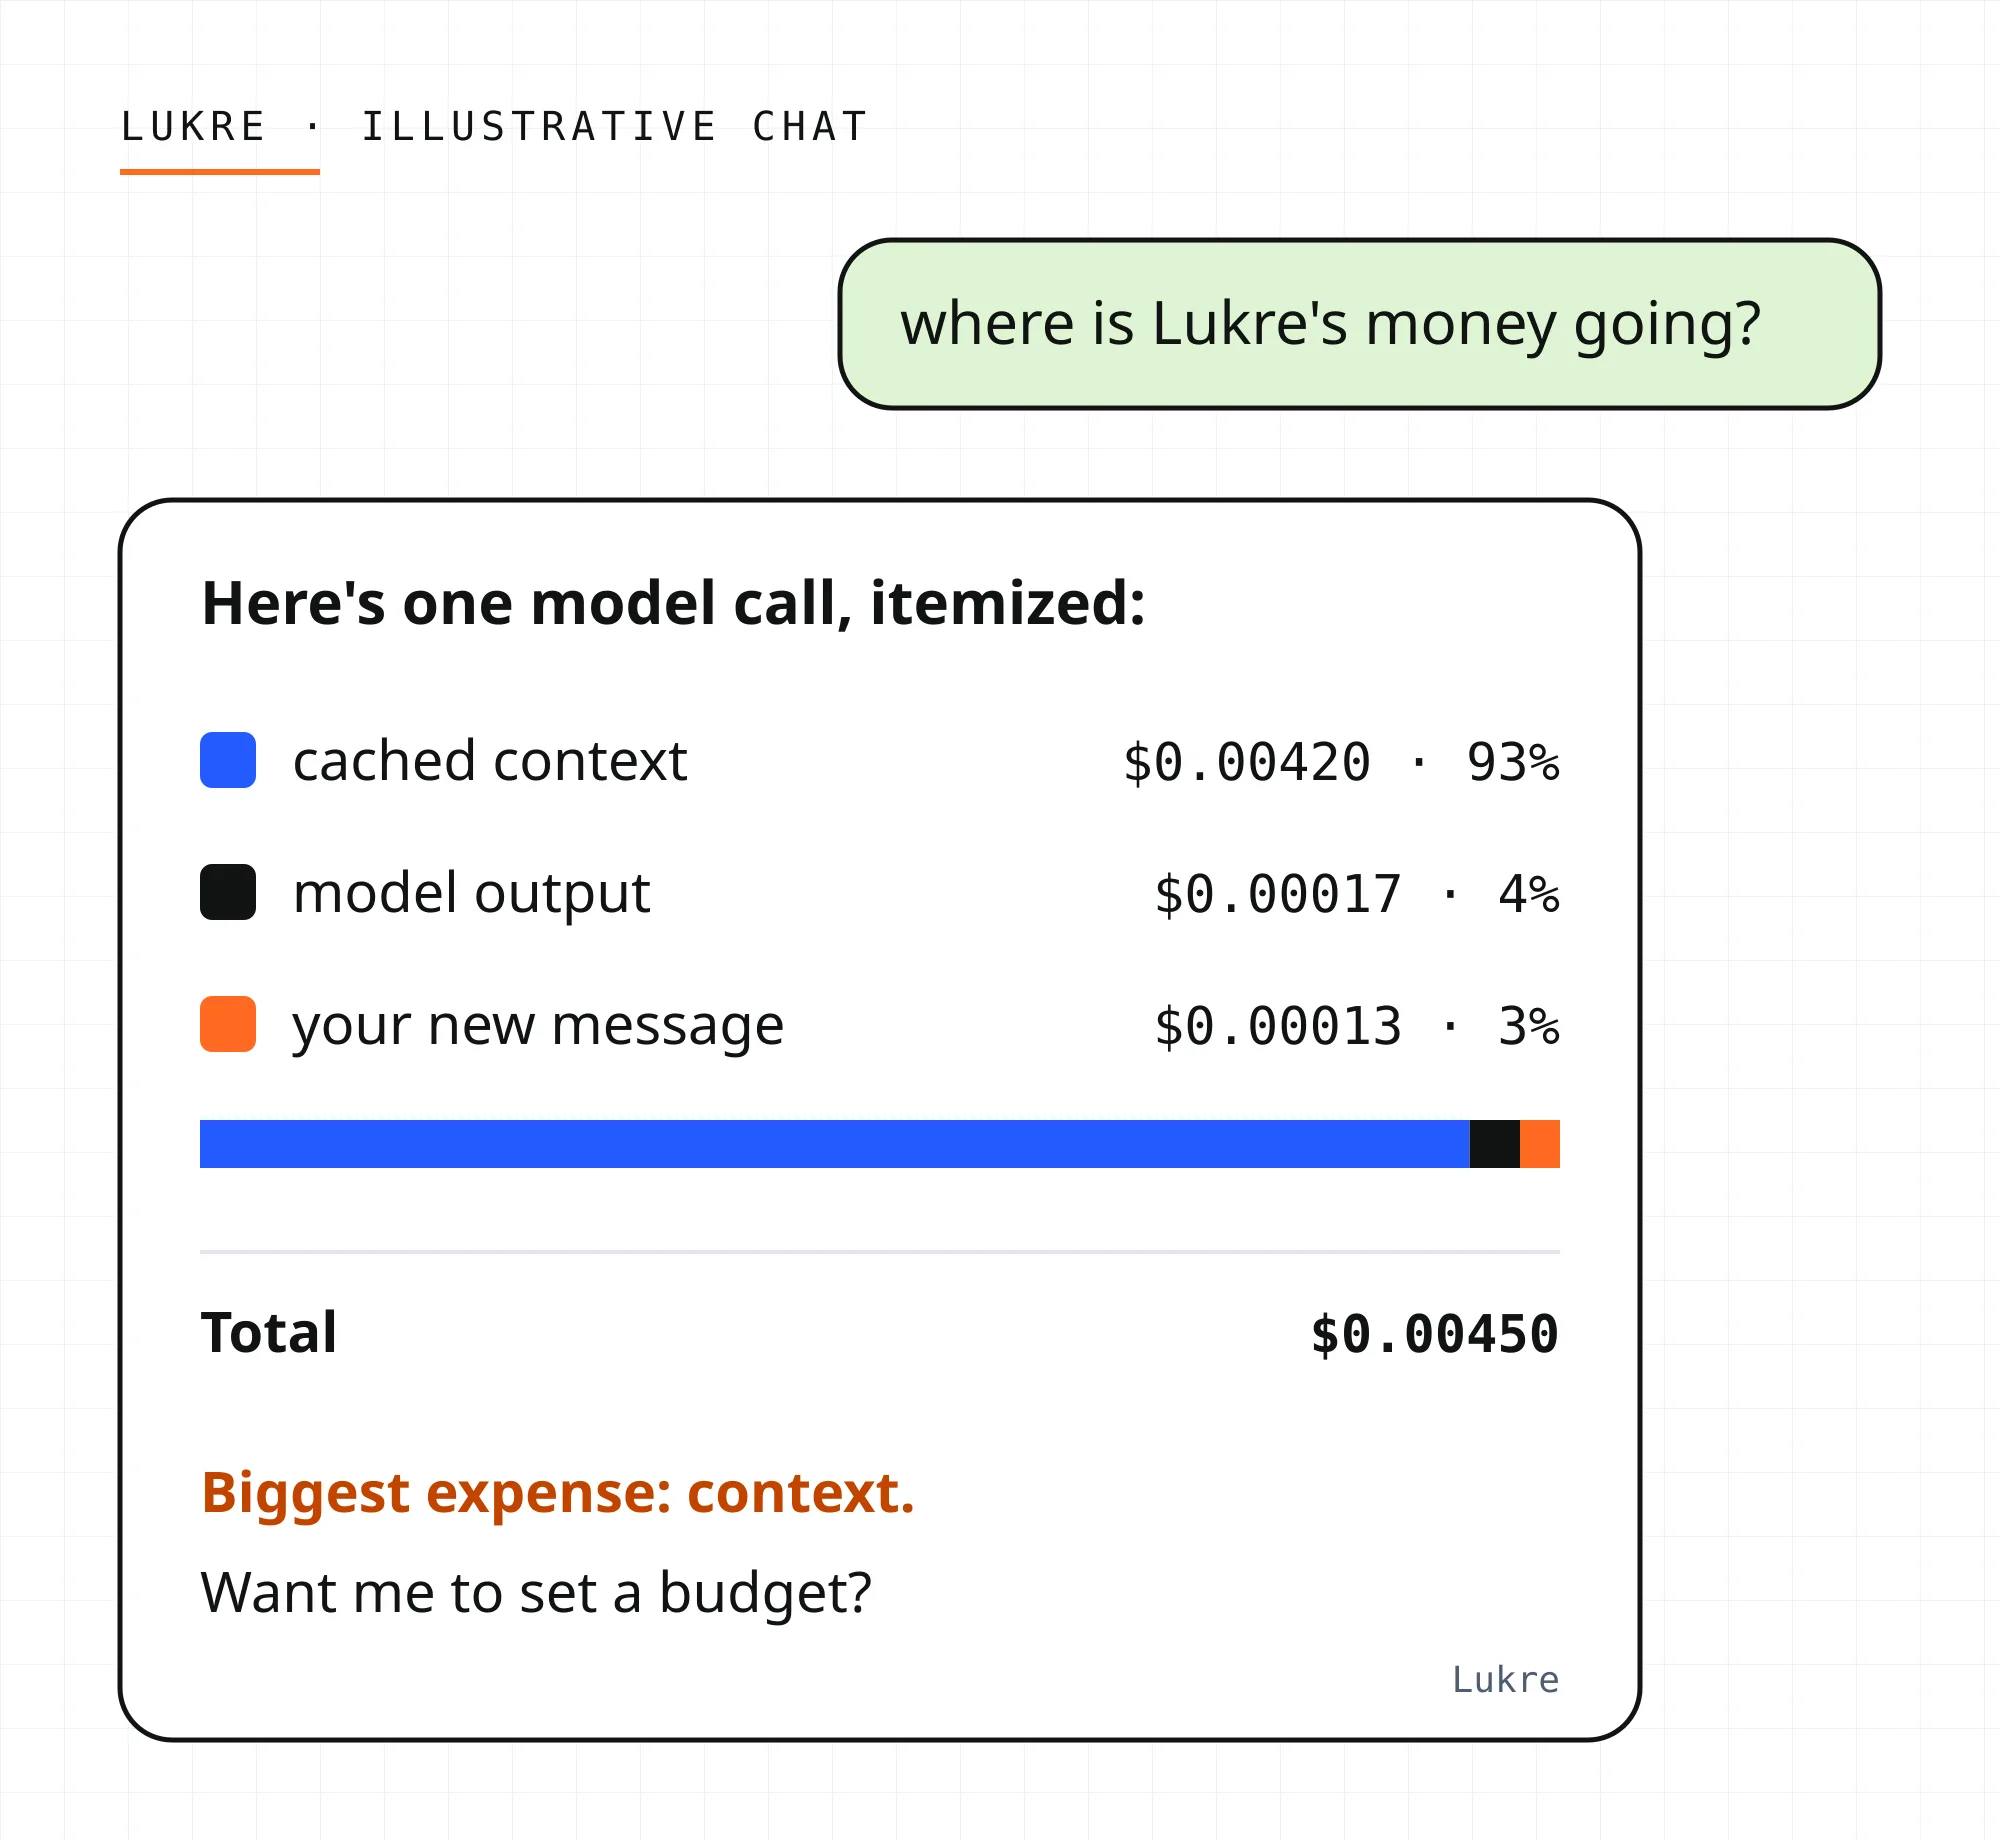
Illustrative conversation. The breakdown is the estimated cost of one production call.
So now Lukre has its own statement. The next step is the one every household knows: cutting the expense that hides in plain sight.
You can see Lukre and what it does, or read how it’s built in Building Lukre.